iTec5
Equipa 1 / Team 1
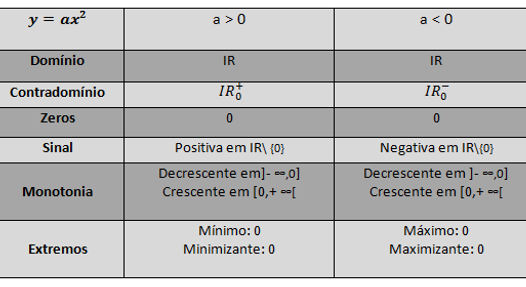
Let´s analise the behaviour of the graphics for the diferent values of a.
When a>0 we have the following examples:
If f(x)= 0.5x²
If g(x)= 4x²
All the parables of these graphics have characteristics in common:
Vertex (0.0)
Concavity facing up
When a<0 we have the following examples:
If f(x)= - 0.5x²
If g(x)= - 4x²
All the parables of these graphics have characteristics in common:
Vextex (0,0)
Concavity facing down
In all this analysis we obtain the following information:
-
The sinal of a influences the direction of concavity
-
The value of a influences the opening of the parable. The higher your absolute value less its opening
-
All these parables have vertex at the point (0.0) and the symmetry is the line x = 0, we can conclude that are independent of a.
Família de funções do tipo y=ax²; a≠0 | Family functions type y=ax²; a≠0
Vamos analisar o comportamento dos gráficos para diferentes valores de a .
Quando a>0 temos os seguintes exemplos:
Se f(x)= 0.5x²
Se g(x)= 4x²
Todas as parábolas destes gráficos têm características em comum:
Vértice(0,0)
Concavidade voltada para cima
Quando a<0 temos os seguintes exemplos:
Se f(x)= - 0.5x²
Se g(x)= - 4x²
Todas as parábolas destes gráficos têm características em comum:
Vértice (0,0)
Concavidade voltada para baixo
De todas estas análises obtemos as seguintes informações:
-
O sinal de a influencia o sentido da concavidade
-
O valor de a influencia a abertura da parábola. Quanto maior o seu valor absoluto, menor a sua abertura
-
Todas estas parábolas tem vértice no ponto (0,0) e o eixo de simetria é a reta x=0,podemos concluir que são independentes de a.